Building a Power Bi Dashboard
Enterprise Multi-Page Power BI Architecture, Custom DAX Modeling & Resource Optimization for 1,470 Employees
Page 1: Executive Dashboard
High-level operational overview synthesizing macro revenue pipelines, project portfolio health indicators, monthly gross margin velocity, and client delivery distribution across global regions.
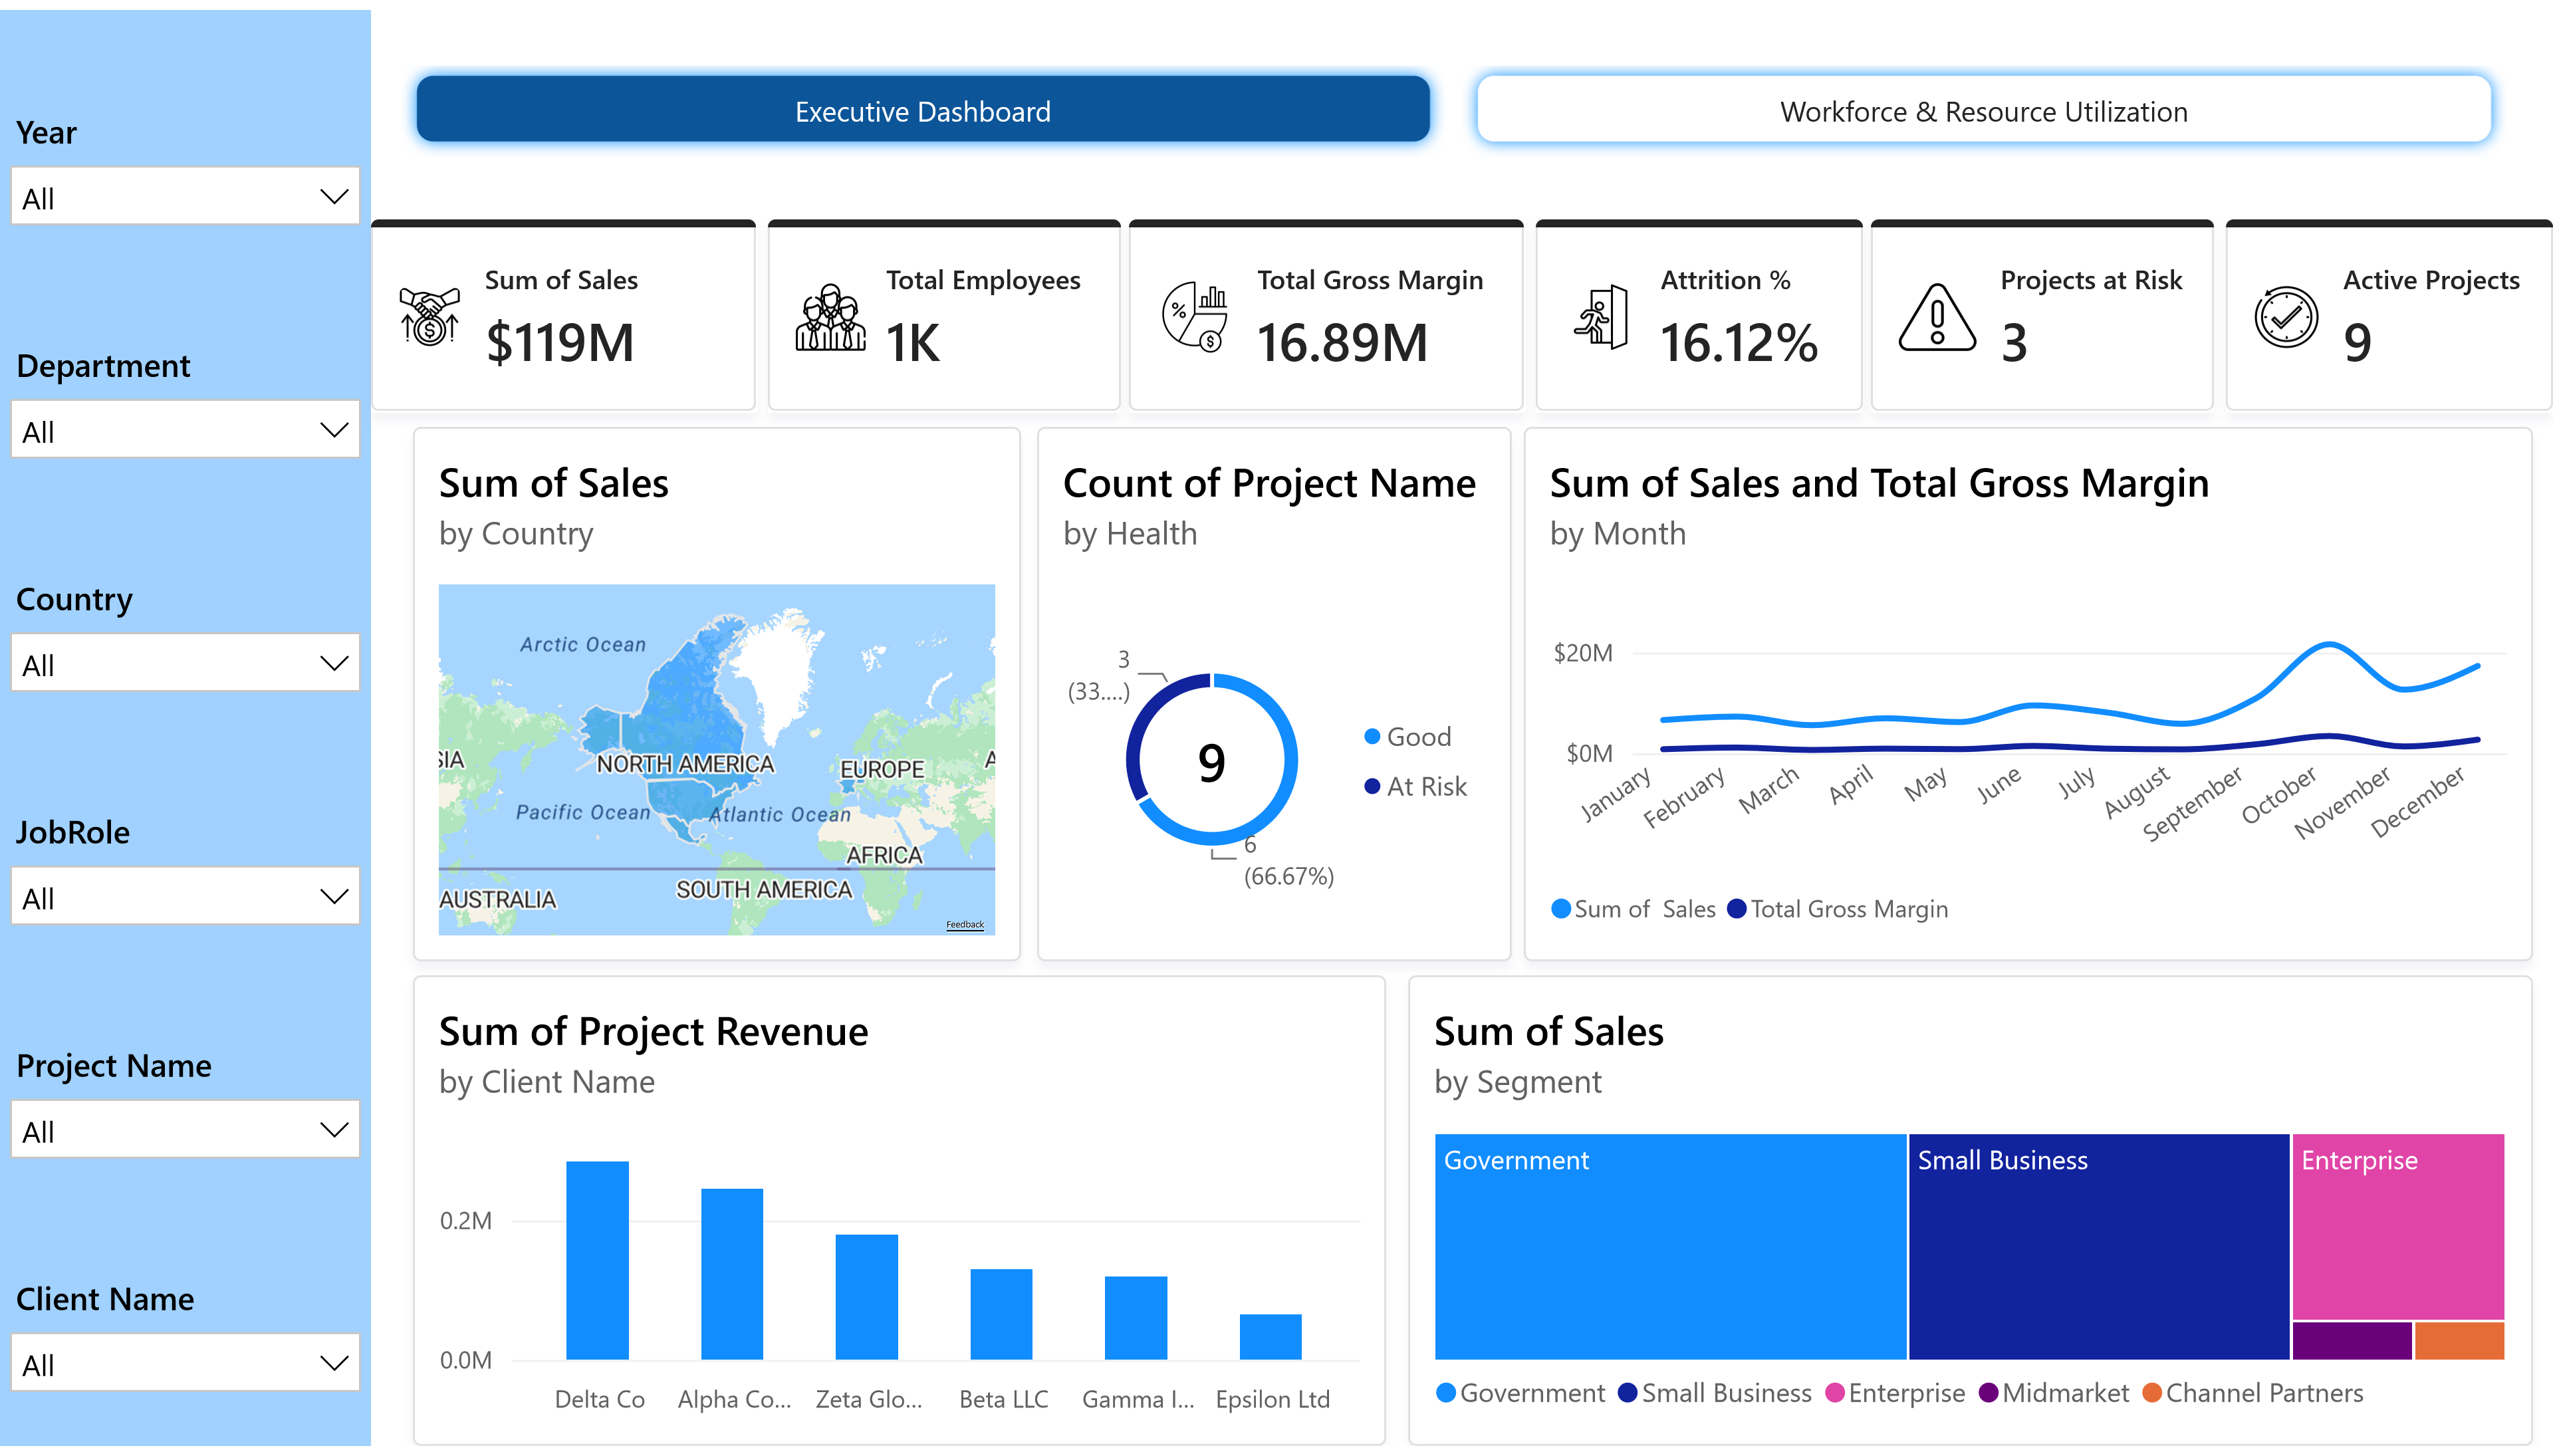
Interactive choropleth map correlating sales volumes with regional operations across North America, Europe, Africa, Australia, and Asia-Pacific to evaluate territorial market penetration.
Pareto distribution of client billings identifying top enterprise accounts contributing over $0.2M+ in recurring billings versus midmarket tier clients.
Hierarchical treemap visualizing market share across Government contracts, Small Business engagements, Enterprise clients, and Channel Partners.
Page 2: Workforce & Resource Utilization
Deep-dive operational analytics dashboard modeling headcount allocation across 1,470 personnel, billable vs. bench ratios, departmental compensation structures, overtime intensity, and attrition vulnerability.
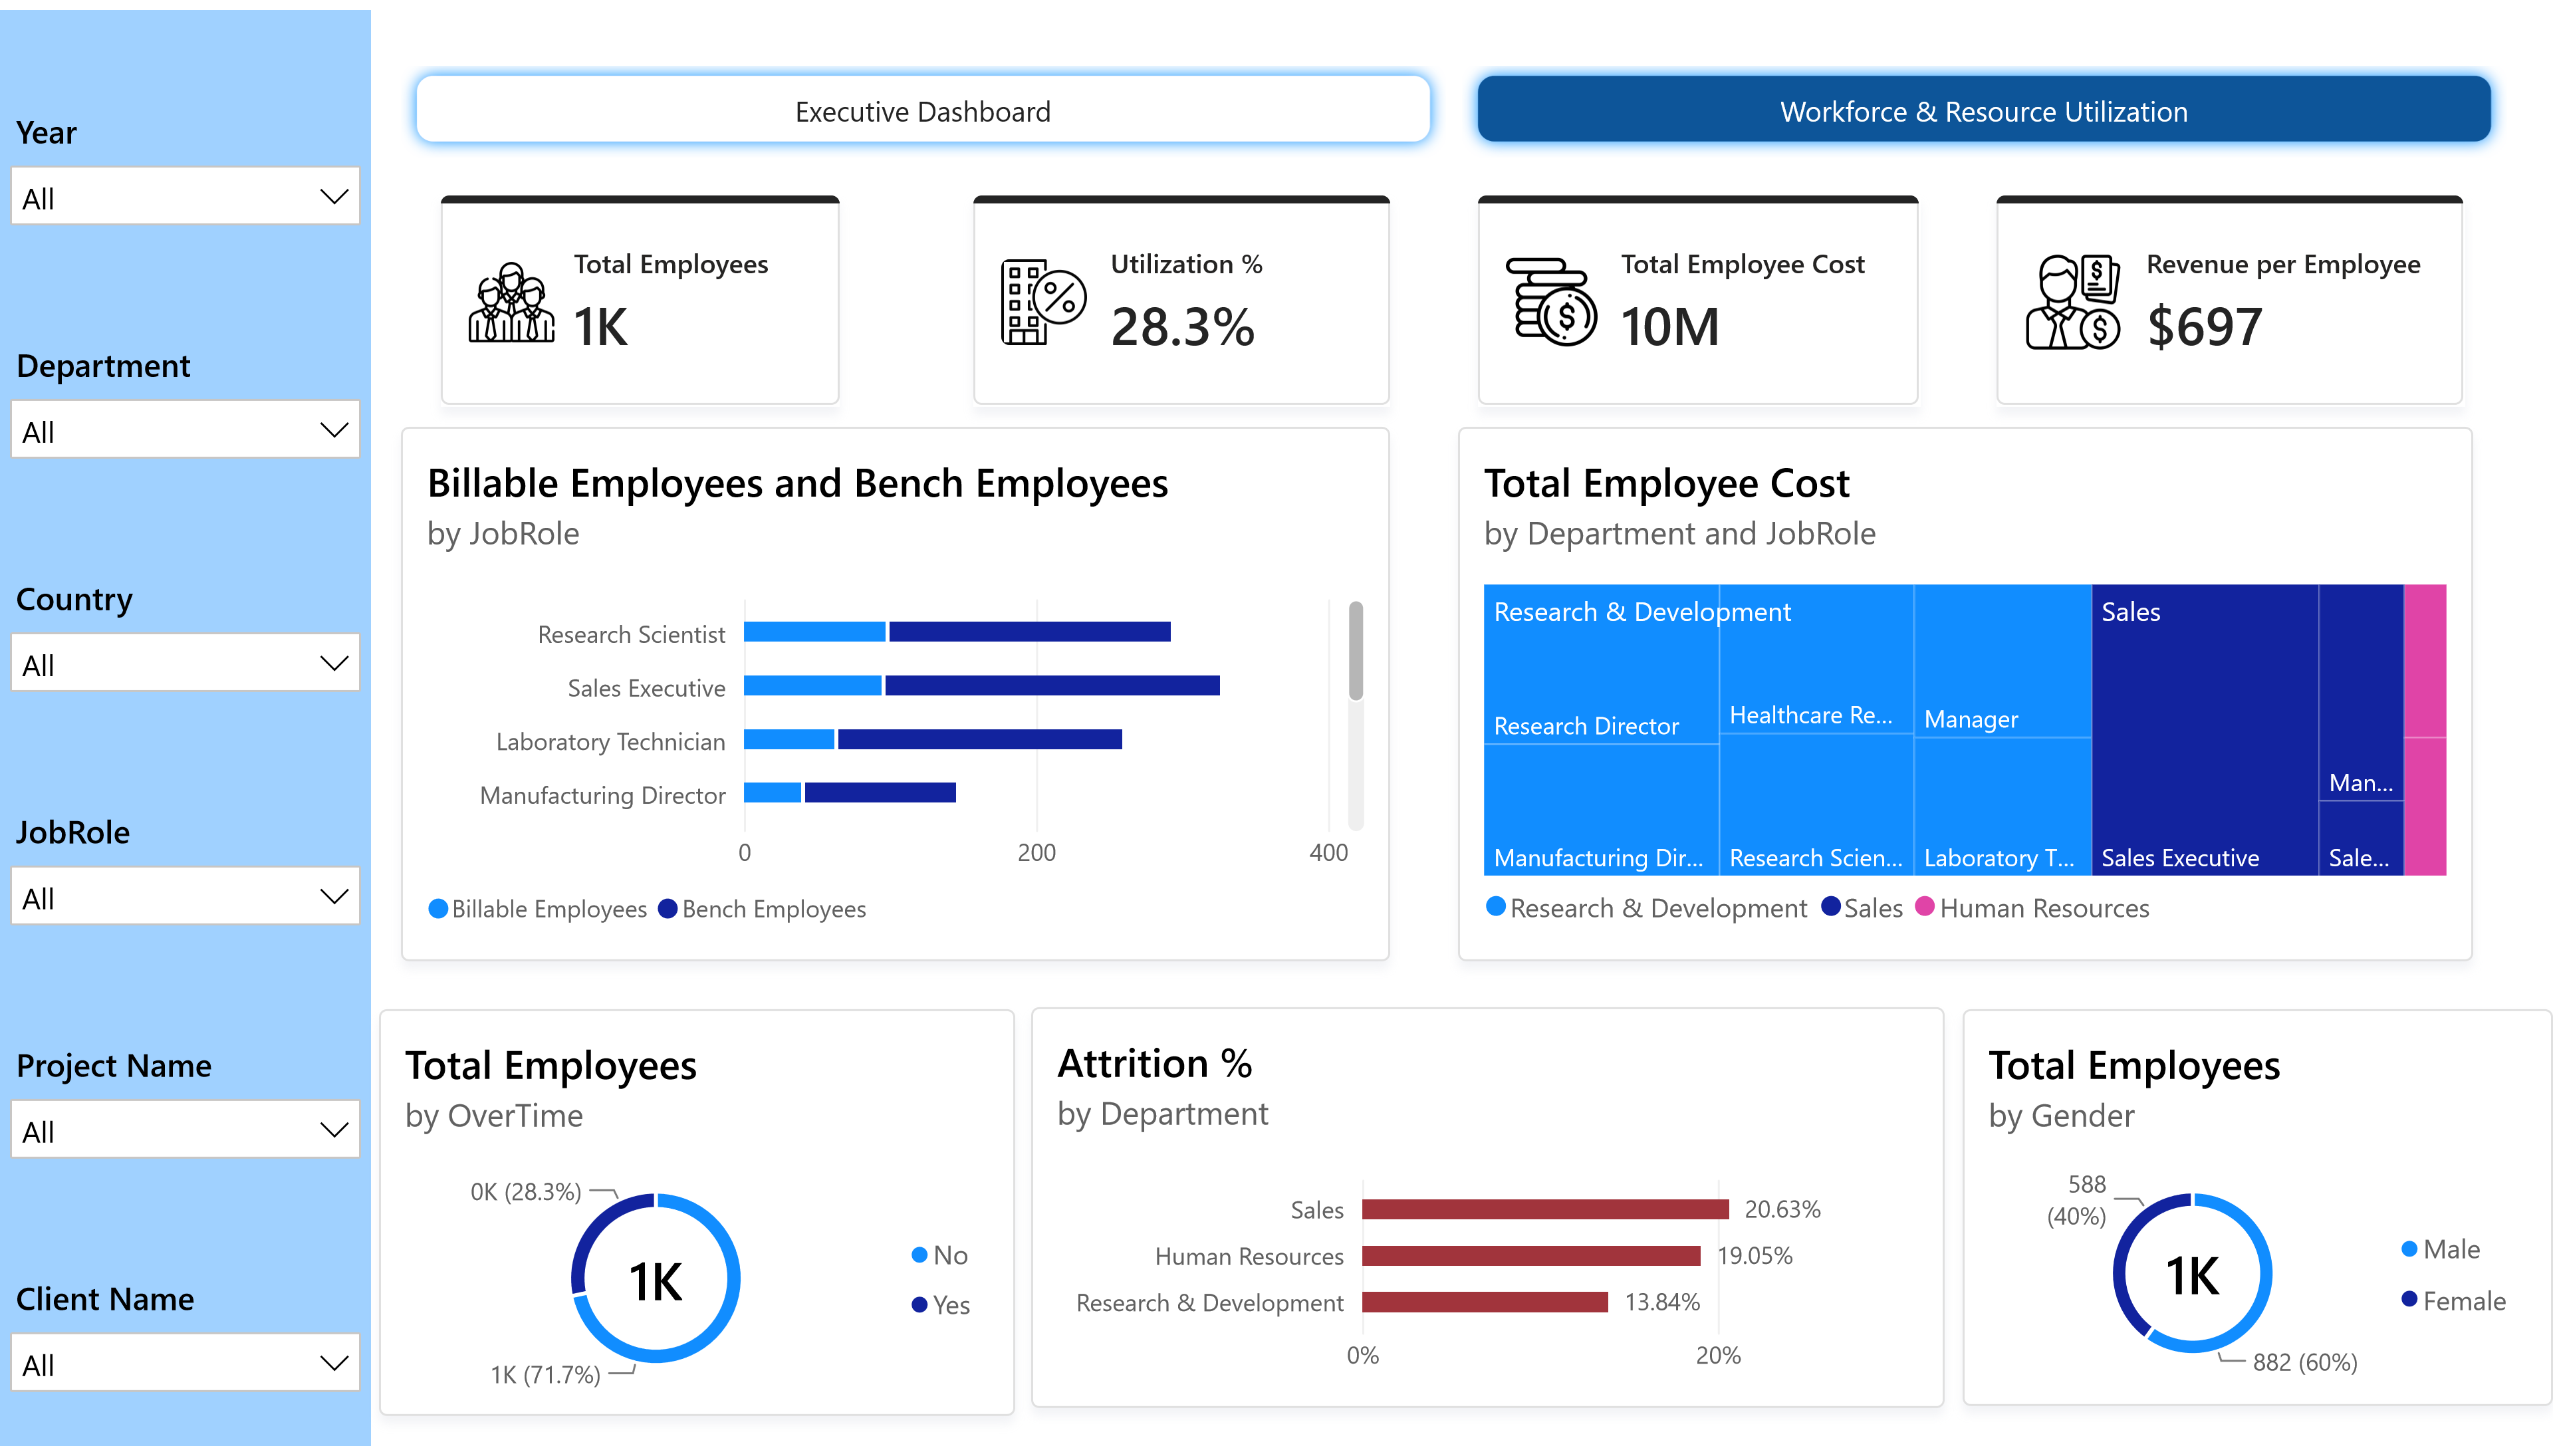
Full headcount mapping covering 882 Male personnel (60%) and 588 Female personnel (40%), enabling cross-filtering across seniority levels and technical departments.
Pinpointed that 28.3% of the workforce actively logged overtime hours, correlating workload exhaustion with the corresponding departmental attrition spikes in Sales.
Multilevel treemap dissecting compensation expenditure across Research & Development, Sales, and HR to quantify average cost and revenue yield per employee ($697).
Data Architecture & DAX Measures
Behind the visual layer, the analytics engine relied on an automated Power Query ETL pipeline, a star schema relational data model, and custom DAX measures engineered to calculate dynamic utilization and risk thresholds on the fly.
Sample Custom DAX Formulations
Power Query ETL & Star Schema
- Data Ingestion & Cleansing: Imported messy employee tracking logs and transactional billing tables. Cleansed null values, standardized date formatting, and created unified employee surrogate keys using Power Query.
-
Star Schema Optimization: Structured a central fact table (
Fact_WorkforceUtilization) linked through one-to-many relationships to five dimension tables (Dim_Employee,Dim_Project,Dim_Client,Dim_Department, andDim_Date). - Interactive Slicer Synchronization: Configured cross-filtering across 6 global slicers (Year, Department, Country, JobRole, Project Name, Client Name) with bidirectional cross-filtering disabled to preserve sub-second query performance.
HCLTech Internship Certificate
Verified certificate of completion for the Data Analytics Internship at HCLTech, certifying expertise in enterprise business intelligence, dashboard modeling, and operational performance analysis.
View HCLTech Certificate (PDF)